Case 7 — Color Flow Doppler

Color flow Doppler of the pulmonic valve region in systole (arrow on ECG indicates immediately after the QRS complex). Laminar blood flow moves away from the transducer (blue) in the right ventricular outflow tract (RVOT). The flow aliases (turns from blue to gold) just before the pulmonic valve when velocity exceeds 0.64 m/s (Nyquist limit). The signal narrows at the valve, then broadens into a large turbulent jet in the main pulmonary artery (PA).

Color flow Doppler of the pulmonic valve region in systole. Laminar flow in the RVOT (blue) aliases at the valve (Nyquist limit: 0.64 m/s), then broadens into a large turbulent jet in the main pulmonary artery (PA).

Same view as above but taken in diastole. A low-velocity jet originates at the pulmonic valve and extends back into the right ventricular (RV) outflow tract. The flow aliases but does not attain the mosaic pattern of a high-velocity turbulent jet, confirming low velocity.

Same view, taken in diastole. A low-velocity jet originates at the pulmonic valve and extends back into the right ventricular outflow tract. The flow aliases without attaining the mosaic pattern of a high-velocity turbulent jet.
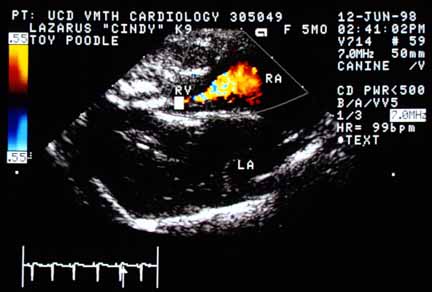
Color flow Doppler image taken in systole from the tricuspid valve region. A high-velocity turbulent jet originates at the tricuspid valve and extends back into the right atrium (RA). The jet is turbulent at its origin and for about one centimeter into the right atrium, then broadens and loses momentum as it dissipates.

Color flow Doppler in systole from the tricuspid valve region. A high-velocity turbulent jet originates at the tricuspid valve and extends into the right atrium (RA), losing momentum as it dissipates.

Video of an echocardiogram from another dog with the same disease

Color flow Doppler patterns similar to the first two still images above.

Color flow Doppler pattern similar to the third still image above.


Quiz

1. The abnormality in the first image is characteristic of what?

2. What does the second image show?

3. What hemodynamic abnormality is demonstrated in the last image?